Genomics Toolkit

Analysis Methods

Explore a curated suite of visualization tools and analysis pipelines — hover over any card to learn more, then click to get started.

82Plot Types
4Workflows

Single-Cell RNA-seq Analysis

Scanpy · Seurat

Single-cell RNA-seq analysis

Single-Cell RNA-seq Analysis


Build a single-cell pipeline stage by stage on Scanpy or Seurat. Quality control and doublet filtering feed dimensionality reduction, clustering, cell-type annotation, and trajectory or RNA velocity — each stage streaming a live run log and figures.

Differential Expression Analysis

DESeq2 · limma · limma-voom · edgeR

Differential expression analysis

Differential Expression Analysis


Compare two sample groups with DESeq2, edgeR, limma-voom, or limma. Choose a metadata column and groups to generate differential results, volcano/MA plots, a heatmap, and key diagnostics.

PCA Analysis

Dimensionality Reduction

PCA analysis

PCA Analysis


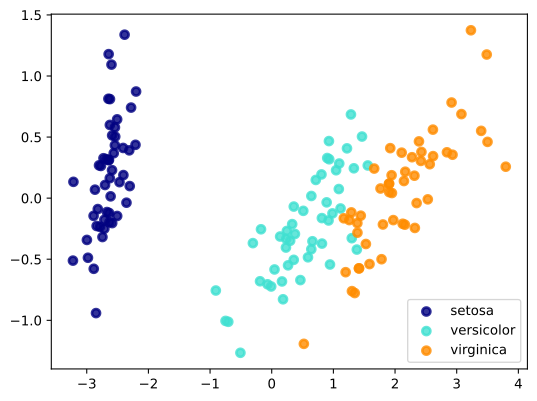
Reduce high-dimensional expression data to principal components. Reveals sample clustering, batch effects, and major sources of variation in your dataset.

Survival Analysis

Kaplan-Meier Curves

Survival analysis

Survival Analysis


Assess the association between gene expression and patient survival outcomes. Generates Kaplan-Meier curves to compare survival probabilities between high and low expression groups.

Correlation Bubble Plot

Coefficients Sized by Significance

Correlation Bubble Plot preview

Correlation Bubble Plot


Encodes correlation direction by colour and significance or abundance by bubble size, with grouped and faceted layouts; every column role is its own control, so uploads with other headers map without renaming.

View provenance

Correlation Density Matrix

Spearman Tiles + Pairwise Scatters

Correlation Density Matrix preview

Correlation Density Matrix


Combines density-coloured lower panels with Spearman coefficient tiles for compact exploration of two to twelve numeric variables.

View provenance

Joint Regression with Residual Box Plot

Log-Log Fit + Group Residuals

Joint Regression with Residual Box Plot preview

Joint Regression with Residual Box Plot


Fits a completeness-corrected log-log regression with group marginal distributions and an inset residual box-plot comparison.

View provenance

Split-Triangle Correlation Clustermap

Two Cohorts, Two Dendrograms

Split-Triangle Correlation Clustermap preview

Split-Triangle Correlation Clustermap


Compares two cohorts with Pearson heatmap tiles, independent hierarchical orders, paired edge labels, and aligned top and bottom dendrograms.

View provenance

Clustered Correlation Pheatmap

Annotated Clustered Matrix

Clustered Correlation Pheatmap preview

Clustered Correlation Pheatmap


Displays a clustered numeric matrix with row annotations, searchable group filtering, dendrogram controls, and a zero-centred diverging scale.

View provenance

Saturation Mutational Energy Heatmap

Substitution Energy by Site

Saturation Mutational Energy Heatmap preview

Saturation Mutational Energy Heatmap


Maps mutation energy across sites and amino-acid substitutions, with smooth or tiled cells and an aligned mean-energy trace.

View provenance

Split-Triangle Correlation Heatmap

Two Datasets in Opposite Halves

Split-Triangle Correlation Heatmap preview

Split-Triangle Correlation Heatmap


Compares two feature-correlation matrices in one triangle: the first dataset fills the upper half and the second the lower, as significance-filtered circles or split cells, with shared or independent palettes.

View provenance

Grouped Correlation Heatmap

Module Blocks + Significance Mask

Grouped Correlation Heatmap preview

Grouped Correlation Heatmap


Applies log10 preprocessing by default, then draws a square correlation matrix grouped by variable_group, with optional clustering and significance blanking tested on the sample observations.

View provenance

Bile-Acid Correlation Composite

Pearson Triangle + Abundance Bars

Bile-Acid Correlation Composite preview

Bile-Acid Correlation Composite


Combines a five-class summary, clustered bile-acid correlations and raw-concentration abundance bars in one aligned figure. Sample and bile-acid IDs are limited to 128 Unicode characters, group values to 32; control characters are rejected.

View provenance

Clustered Triangular Correlation Heatmap

Rotated Triangle Below Dendrogram

Clustered Triangular Correlation Heatmap preview

Clustered Triangular Correlation Heatmap


Rotates a hierarchically clustered correlation matrix into a compact triangle with a matched dendrogram and group-coloured labels.

View provenance

Venn Plot

Shared Identifier Overlap

Venn Plot preview

Venn Plot


Compares exact identifier overlap among two, three, or four selected groups, with explicit membership counts and publication-ready styling.

View provenance

UpSet Plot

Set Intersection Sizes

UpSet Plot preview

UpSet Plot


Ranks exact intersections across many sets using coordinated size bars and a membership matrix, with binary-matrix and directional differential-expression modes.

View provenance

Multi-Stage Alluvial Impact Plot

Splits and Merges Across Stages

Multi-Stage Alluvial Impact Plot preview

Multi-Stage Alluvial Impact Plot


Tracks weighted observations through three or more ordered stages, revealing how categories split, merge, and propagate downstream.

View provenance

Circos Expression Intersection

Ring Heatmaps + Shared Features

Circos Expression Intersection preview

Circos Expression Intersection


Links circular expression profiles to shared-feature membership, with Venn or UpSet views for comparing intersections among gene sets.

View provenance

CRISPR Hyperbolic Volcano Plot

Screen Hits by Decision Boundary

CRISPR Hyperbolic Volcano Plot preview

CRISPR Hyperbolic Volcano Plot


Highlights CRISPR screening hits with hyperbolic or rectangular decision boundaries, helping distinguish strong guide-level effects from background signals.

View provenance

Differential Abundance Beeswarm Plot

Feature Effects per Comparison

Differential Abundance Beeswarm Plot preview

Differential Abundance Beeswarm Plot


Shows feature-level differential-abundance effects as deterministic beeswarm points, supporting a single gradient view or multiple comparison panels.

View provenance

Differential Expression Volcano Plot

Log2 Fold Change vs Significance

Differential Expression Volcano Plot preview

Differential Expression Volcano Plot


Plots effect size against statistical significance to identify up- and down-regulated features, with single, mirrored, cluster-faceted, and overview layouts.

View provenance

Expression Bubble Heatmap

Mean Level and Percent Detected

Expression Bubble Heatmap preview

Expression Bubble Heatmap


Encodes effect direction by color and magnitude by bubble size across features, targets, and groups, with faceted or separated-row layouts.

View provenance

Fold-Change Comparison

Two-contrast Effect Concordance

Fold-Change Comparison preview

Fold-Change Comparison


Compares fold changes from two contrasts on shared axes, highlighting top hits or features significant in both comparisons.

View provenance

RNA Translation Quadrant Plot

Polysome vs Total RNA Changes

RNA Translation Quadrant Plot preview

RNA Translation Quadrant Plot


Contrasts total-RNA and polysome-RNA fold changes to classify transcriptional, translational, and buffering responses.

View provenance

Significance Heatmap

Effect Sizes with Asterisk Marks

Significance Heatmap preview

Significance Heatmap


Combines effect magnitude and statistical significance in a grouped heatmap, with layouts for facet panels or visual separator rows.

View provenance

Faceted TF Activity Heatmap

Active vs Repressed per State

Faceted TF Activity Heatmap preview

Faceted TF Activity Heatmap


Displays transcription-factor activity across cell states as active and repressed tile rows split into TF-set facets, with a significance dot per tile and an optional summary strip.

View provenance

TF Pair Activity Heatmap

Co-activation vs Co-repression

TF Pair Activity Heatmap preview

TF Pair Activity Heatmap


Compares activation and repression scores for paired transcription factors in a symmetric heatmap, making direction, magnitude, and pair-specific balance easy to inspect.

View provenance

Volcano and Enrichment Composite

DE Hits + Pathway Summaries

Volcano and Enrichment Composite preview

Volcano and Enrichment Composite


Pairs a differential-expression volcano plot with pathway enrichment summaries or an enrichment network to connect individual hits with biological programs.

View provenance

Volcano Plot with Gene-Set Rug

Member Positions + GSEA Curves

Volcano Plot with Gene-Set Rug preview

Volcano Plot with Gene-Set Rug


Adds ranked gene-set enrichment trajectories and rug marks to a volcano plot, showing where pathway members fall across differential results.

View provenance

Circular UMAP Annotation Plot

Cell Type · Time · Condition Rings

Circular UMAP Annotation Plot preview

Circular UMAP Annotation Plot


Wraps UMAP coordinates with multidimensional sample annotations so cell type, time point, and condition can be reviewed together.

View provenance

Ordination with Marginal Distributions

PCoA/NMDS Separation + PERMANOVA

Ordination with Marginal Distributions preview

Ordination with Marginal Distributions


Displays PCoA or NMDS coordinates together with marginal box plots per group and a PERMANOVA panel, revealing group separation and axis-wise spread in one view. Each row is one sample; the method column selects which ordination the variant draws, and the two-factor variant colours the points by group and shapes them by a second factor column, with box plots for each factor on both axes.

View provenance

Violin and NMDS Composite

Group Metric + Sample Ordination

Violin and NMDS Composite preview

Violin and NMDS Composite


Combines NMDS sample ordination with violin distributions of diversity or distance metrics for a coordinated group-level comparison.

View provenance

Annotated Phylogenetic Tree

Circular Clades and Tip Tracks

Annotated Phylogenetic Tree preview

Annotated Phylogenetic Tree


Renders a rooted phylogenetic tree with categorical rings, clade markers, point tracks, and heatmap-style tip annotations.

View provenance

Ternary Scatter Plot

Three-component Mixtures

Ternary Scatter Plot preview

Ternary Scatter Plot


Transforms three non-negative components into ternary coordinates and supports categorical, continuous-gradient, or category-plus-size point encodings.

View provenance

Clinical Longitudinal Timeline

Per-patient Treatment History

Clinical Longitudinal Timeline preview

Clinical Longitudinal Timeline


Places clinical metadata, treatments, surgery, recurrence, dense multi-site sampling, and death on patient-level longitudinal timelines.

View provenance

Patient Swimmer Plot

Treatment Lanes + Best Response

Patient Swimmer Plot preview

Patient Swimmer Plot


Shows metadata tracks, treatment intervals, best response, and stop status along one lane per patient, with standard or trial-grouped layouts. Rows use the canonical headers of the sample file: treatment rows carry start, end, treatment, stop_reason and ongoing; event rows carry event_time and response (SD, PR or CR); the five metadata columns fill the tracks and the legend.

View provenance

Effect-Size Forest Plot

Interval Estimates + Result Table

Effect-Size Forest Plot preview

Effect-Size Forest Plot


Displays precomputed beta, hazard-ratio, odds-ratio, or risk-ratio estimates with confidence intervals beside an aligned result table. Ratio estimates are drawn on a log axis with the reference at 1; betas on a linear axis with the reference at 0. The beta_threshold layout shades Moderate and High bands at two thresholds, single_hr_grouped stacks rows under a header per group and colours points by the p-value threshold, and dual_hr draws exactly two groups per outcome side by side.

View provenance

Butterfly Stacked Bar Plot

Back-to-back Cohort Composition

Butterfly Stacked Bar Plot preview

Butterfly Stacked Bar Plot


Compares two sides with back-to-back stacked bars, supporting raw counts or within-side percentages while retaining category composition.

View provenance

Butterfly Violin Plot

Mirrored Densities per Feature

Butterfly Violin Plot preview

Butterfly Violin Plot


Mirrors continuous-value distributions for two sides across features, making differences in shape, spread, and threshold crossing visible.

View provenance

Repeated-Measures Time-Series Plot

Subject Lines Under Group Means

Repeated-Measures Time-Series Plot preview

Repeated-Measures Time-Series Plot


Connects repeated observations from the same sample or subject across time while retaining group-level summaries: per-group mean with SE, SD or 95% CI bars, optional per-subject trajectories, shaded phase windows read from a phase column, and per-time-point post-hoc labels (t-test or Wilcoxon, multiplicity-adjusted) when exactly two groups are present.

View provenance

Time-Series Plot

Group Trends with Uncertainty

Time-Series Plot preview

Time-Series Plot


Shows grouped trajectories over time with ribbons, error bars, or facets to compare central trends and uncertainty. The table carries time and value, an optional symmetric error or explicit lower/upper bounds, and optional group, facet and display_style columns; replicate rows at one time point are averaged. Reference lines are drawn only when Reference X or Reference Y is set.

View provenance

Sample Geographic Distribution

Site Composition on a Basemap

Sample Geographic Distribution preview

Sample Geographic Distribution


Maps sample counts or compositions to locations on a world or China basemap as pies, bubbles or a choropleth with pies. Rows are typed by record_type: point locations, composition slices, and optional polygon and line overlays with vertex_order. Category and zone colour objects, axis limits and the bubble size range are available to API callers.

View provenance

Enrichment Network Composite

Volcano + Pathway Overlap Clusters

Enrichment Network Composite preview

Enrichment Network Composite


Pairs a dense differential-expression volcano with a clustered pathway-overlap network, with an alternate circos-network layout.

View provenance

BCR/SHM Composition Composite

Isotype Mix + Hypermutation Rate

BCR/SHM Composition Composite preview

BCR/SHM Composition Composite


Summarizes B-cell receptor composition and somatic hypermutation metrics in a coordinated multi-panel figure.

View provenance

Dual-Axis Bar Plot

Two Measures on Separate Axes

Dual-Axis Bar Plot preview

Dual-Axis Bar Plot


Combines primary bars with a secondary line/point series or nested bars when two related measures require distinct scales.

View provenance

Petal Radial Bar Plot

Treatment Groups per Trait

Petal Radial Bar Plot preview

Petal Radial Bar Plot


Arranges values as petal-like radial bars and optionally adds error ranges and significance annotations.

View provenance

Radial Bar Plot

Values Grouped by Sector

Radial Bar Plot preview

Radial Bar Plot


Shows ordered values as radial bars with group colors, value gradients, or both for compact circular comparison.

View provenance

Radial Bar with Center Pie

Magnitude Ring + Composition Core

Radial Bar with Center Pie preview

Radial Bar with Center Pie


Places radial bars around a central composition pie to compare category-level magnitude with the overall proportion structure.

View provenance

Radial Hierarchy Network

Parent-child Levels + Magnitude

Radial Hierarchy Network preview

Radial Hierarchy Network


Displays hierarchical categories around a circle as radial bars or bubbles, preserving parent-child structure and magnitude.

View provenance

Grouped Stacked Bar Plot

Proportions Across Nested Groups

Grouped Stacked Bar Plot preview

Grouped Stacked Bar Plot


Displays category composition as grouped stacked bars with sectioned or faceted layouts for multi-level comparisons.

View provenance

Stacked Dot Plot with Inset Pie

Per-sample Counts + Group Share

Stacked Dot Plot with Inset Pie preview

Stacked Dot Plot with Inset Pie


Combines stacked dot counts with an inset pie summary so detailed observations and overall composition can be read together.

View provenance

Statistical Bar Plot

Post-hoc Mean Comparisons

Statistical Bar Plot preview

Statistical Bar Plot


Compares grouped means with uncertainty and post-hoc significance annotations for Tukey, LSD, or Dunnett testing results.

View provenance

Comparison Violin Plot

Side-by-side Group Distributions

Comparison Violin Plot preview

Comparison Violin Plot


Compares continuous distributions through paired, grouped, overlaid, or faceted-IQR violin layouts.

View provenance

Gradient Distribution Plot

Control vs Treatment Panels

Gradient Distribution Plot preview

Gradient Distribution Plot


Compares reference and specialized groups with source-matched violin or box summaries, independent panel scales, title strips, gradients, and p-value annotations.

View provenance

Paired Box Plot

Linked Subjects Across Conditions

Paired Box Plot preview

Paired Box Plot


Summarizes paired observations with box plots and subject-level connections, with optional facets for repeated comparisons.

View provenance

Radial Distribution Plot

Polar-sector Violins or Boxes

Radial Distribution Plot preview

Radial Distribution Plot


Bends violin or box distributions into radial sectors for compact comparison of multiple groups or features.

View provenance

Circular Association Lollipop Plot

Feature Estimates in a Ring

Circular Association Lollipop Plot preview

Circular Association Lollipop Plot


Places association estimates as lollipops around a circle, supporting compact comparison of many features and groups.

View provenance

Circular Sample Profile

Multi-track Cohort Overview

Circular Sample Profile preview

Circular Sample Profile


Organizes sample metadata and quantitative tracks around a circle for a compact, multi-layer cohort overview.

View provenance

Expectation-Interval Dumbbell Plot

Observed vs Expected Interval

Expectation-Interval Dumbbell Plot preview

Expectation-Interval Dumbbell Plot


Connects observed and expected values with dumbbells while displaying an expected interval for direction and magnitude assessment.

View provenance

Spatial Proximity and Expression Summary

Cell Closeness vs Gene Expression

Spatial Proximity and Expression Summary preview

Spatial Proximity and Expression Summary


Combines spatial cell-neighborhood proximity with expression summaries to relate physical context to molecular signal.

View provenance

Faceted Bubble Regression Panel

Fitted Slopes with Identity Line

Faceted Bubble Regression Panel preview

Faceted Bubble Regression Panel


Creates faceted bubble-scatter panels with fitted regressions, enabling side-by-side comparison of trends across groups.

View provenance

Categorical Matrix Bubble Plot

Direction and Binned Magnitude

Categorical Matrix Bubble Plot preview

Categorical Matrix Bubble Plot


Encodes a categorical matrix with bubble color and size so direction, magnitude, and significance can be compared across cells.

View provenance

Differential OTU Manhattan Bubble Plot

Taxon Fold Changes by Order

Differential OTU Manhattan Bubble Plot preview

Differential OTU Manhattan Bubble Plot


Plots differential OTU effects across ordered taxa as Manhattan-style bubbles, encoding direction, significance, and abundance.

View provenance

Ecosystem Change Regression Composite

Pressure-response Regressions

Ecosystem Change Regression Composite preview

Ecosystem Change Regression Composite


Combines ecosystem-change measurements with fitted regressions and marginal summaries to compare coordinated responses.

View provenance

Grouped Categorical Scatter with Significance

Jittered Points + Test Brackets

Grouped Categorical Scatter with Significance preview

Grouped Categorical Scatter with Significance


Shows categorical groups as jittered points with optional publication-style significance brackets. Columns are fixed: category, group, sample_id, value, plus optional comparison_group and p_value for explicit brackets; without p-values the publication style computes a paired test between the first two groups per category. Groups matching the hollow pattern are drawn as open circles.

View provenance

Paired Scatter with Marginal Difference Histogram

Within-pair Differences + Test

Paired Scatter with Marginal Difference Histogram preview

Paired Scatter with Marginal Difference Histogram


Compares paired measurements in a scatter plot and summarizes within-pair differences in an inset histogram. Requires subject, control and treat columns; an optional significant column (yes/no) overrides the difference threshold and an optional label column annotates named subjects. A paired Wilcoxon or t test is reported unless the test method is none.

View provenance

Regression Scatter Plot

Linear Fit + Pearson Statistics

Regression Scatter Plot preview

Regression Scatter Plot


Fits an annotated linear relationship (r, P value, confidence band and quadrant arrows) or a per-group polynomial summary with mean-and-sd whiskers to x/y points. Columns are fixed: x and y are required; group, label and highlight are optional, and only highlighted rows are labelled.

View provenance

Bidirectional-Error Scatter with Marginals

X/Y Error Bars + Count Histogram

Bidirectional-Error Scatter with Marginals preview

Bidirectional-Error Scatter with Marginals


Compares a count histogram and KDE above a log-scale scatter with bidirectional uncertainty, spectral classes, and magnitude markers. Groups outside the eleven spectral classes are placed by the numeric color_value column; marker shape follows the magnitude cut points 13 and 15.

View provenance

Smoothed and Fitted Curves

Spline, Logistic and LOESS Fits

Smoothed and Fitted Curves preview

Smoothed and Fitted Curves


Draws grouped (x, y) trajectories as raw lines on a log10 axis, smoothing splines, natural cubic x-splines or four-parameter logistic fits, or compares two groups pair by pair with a LOESS trend and a marginal density inset. Groups take a cold-to-hot colour ladder unless groupColors overrides them; the paired style needs a pair_id shared by both groups.

View provenance

Circular Group Profile

Repeated Measures Around a Cycle

Circular Group Profile preview

Circular Group Profile


Displays grouped profiles as circular lines or circular bars to compare repeated measurements around an ordered cycle.

View provenance

Longitudinal Line and Endpoint Bar Composite

Time Course + Endpoint Means

Longitudinal Line and Endpoint Bar Composite preview

Longitudinal Line and Endpoint Bar Composite


Pairs longitudinal trajectories with endpoint bars, linking within-subject change to final group-level outcomes. Rows tagged record_type = time feed the line panel and record_type = endpoint the bar panel; each group is summarised as mean with SE, SD or 95 percent CI error from at least two samples per condition, and a significance or p_value column is drawn once per condition.

View provenance

Ridge Plot

Stacked Densities by Group

Ridge Plot preview

Ridge Plot


Stacks density ridges across groups or markers and can add rugs, facets, and significance annotations.

View provenance

2D Contour and Joint Density Plot

Probability Isolines + Boundaries

2D Contour and Joint Density Plot preview

2D Contour and Joint Density Plot


Maps one dense joint distribution with probability contours, diagonal conservation boundaries, and labelled feature classes; filled facets and joint marginals remain optional variants.

View provenance

Chord Diagram with Outer Bars

Group Links + Outer Totals

Chord Diagram with Outer Bars preview

Chord Diagram with Outer Bars


Connects groups with a chord diagram and adds aligned outer bars to show group-specific totals or attributes.

View provenance

Faceted Scatter Pie Plot

Composition and Total per Point

Faceted Scatter Pie Plot preview

Faceted Scatter Pie Plot


Draws composition pies at scatter coordinates and separates them into facets for multivariate spatial or ecological comparison.

View provenance

Table-Style Mixed Heatmap

Ranked Method Benchmarking

Table-Style Mixed Heatmap preview

Table-Style Mixed Heatmap


Builds a table-like mixed heatmap: each row draws a tile, circle, bar or text, ranked within its column onto the row's palette, with columns grouped under header bands.

View provenance

Parameter-Recovery Validation Plot

Simulation Bias and Calibration

Parameter-Recovery Validation Plot preview

Parameter-Recovery Validation Plot


Compares true and recovered model parameters to assess bias, uncertainty, calibration, and simulation performance.

View provenance

Sankey Diagram

Multi-stage Flow

Sankey Diagram preview

Sankey Diagram


Trace weighted paths across ordered stages with deterministic node placement, positive-flow validation, optional group filtering, and source-to-target colour gradients.

View provenance

Basic Box Plot

Multi-category Distribution

Basic Box Plot preview

Basic Box Plot


Compare a numeric measurement across many categories with source-faithful boxes, deterministic quasirandom observations, mean labels, and optional comparison annotations.

View provenance

Restricted Cubic Spline Curve

Non-linear Cox Association

Restricted Cubic Spline Curve preview

Restricted Cubic Spline Curve


Model non-linear exposure-risk associations with restricted cubic splines, confidence ribbons, overall and non-linearity tests, and optional mortality insets.

View provenance

Correlation Matrix

Pairwise Correlation

Correlation Matrix preview

Correlation Matrix


Explore pairwise correlations between numeric variables. Displays scatter plots, histograms, and R²/P-value annotations in a comprehensive matrix layout.

View provenance

Correlation Network

Pearson Matrix + Mantel Links

Correlation network preview

Correlation Network


Relate community profiles to environmental variables with Mantel-test links, alongside an upper-triangle Pearson matrix with significance annotations.

View provenance

Radar Profile

Overlay - Facets - Outer Ring - Comparison

Radar Profile preview

Radar Profile


Explore five compatible radar modes from one tool: overlaid profiles, polygon facets, circular facets, annotated outer rings, and explicit group differences or ratios.

View provenance

Mixed-Effects Radar

Repeated Measures - LMM - ANOVA

Mixed-Effects Radar preview

Mixed-Effects Radar


Model repeated observations with a linear mixed-effects analysis, Type-III ANOVA and estimated contrasts, then present the results on an annotated circular radar.

View provenance

Raincloud Distribution

Violin - Box - Jitter - Rain Ticks

Raincloud Distribution preview

Raincloud Distribution


Explore two compatible distribution modes from one tool: a half violin with box and jitter, or a flexible cloud with box summaries and observation-level rain ticks.

View provenance

Differential Raincloud

Half-Eye - Quantiles - Grouped Comparisons

Differential Raincloud preview

Differential Raincloud


Explore three compatible comparison modes from one tool: a differential half-eye cloud, quantile connections for two groups, or grouped treatment comparisons with significance.

View provenance

Showing 86 of 86 methods